



Chin-Shan Lu, Leung Chun Ho, Leung Cheuk Ming, Tsui Chun Yuen
Department of Logistics and Maritime Studies, The Hong Kong Polytechnic University
Abstract
Owing to the tight and rigorous requirements of Halal food, the service quality of transportation in the Halal logistics becomes extremely important. However, the research of Halal transport logistics services are relatively lacking. Thus, this research aims to examine the service quality of Halal transport logistics and its impact on customer loyalty in Hong Kong from a Halal restaurant’s perspective. Using data collected from 30 Halal restaurants in Hong Kong. Based on an importance-performance analysis, resulted indicated that important and need to be improved Halal logistics transport service attributes including on time delivery, delivery consistency, prompt response to claim, response accuracy, information availability and accuracy. In addition, this research found that service quality had a significant correlation with customer loyalty in Halal food transport logistics services.
1.Introduction
Despite Hong Kong is not one of main Islamic areas, but there are over 300,000 Islams in Hong Kong. Most Muslims in Hong Kong are come from India, Malaysia, Middle East and Africa countries (Legislative Council Secretariat, 2017). Halal in Hong Kong is driven by Board of Trustees (BOT) at Incorporated Trustees of the Islamic Community Fund of Hong Kong. BOT is a non-government organization, which is conducting Halal Inspections and issue Halal Certificates. There are 51 Restaurants in Hong Kong Island, Kowloon and New Territories, 13 Hotel restaurants with, 6 Theme Park Restaurants and 3 Airline Kitchens recognized in Halal logo and certification. (The Incorporated Trustees of the Islamic Community Fund of Hong Kong, 2018). Most of these Halal certificate recognized restaurant are provide Indian, Italian, Middle Eastern, Turkish cuisine. Only a few are providing Chinese and Asian food. It indicated that majority of Halal restaurant operators are Indians, Pakistanis Middle East Muslim, and few Chinese Muslim (Mohd Shariff, Yahya & Yeung, 2016).
All restaurants and Kitchens must follow the terms and conditions of issuance for Halal certificate. Halal certification is valid and renewable for one year. Inspection team from BOT would visit the restaurant in order to audit and ensure the Halal standard. As for the transportation aspect of Halal ingredient. BOT special stated that in the requirement. “While transporting meat from one place to another it must not have physical contact or union with non-Halal meat/liquid/items.” (The Incorporated Trustees of the Islamic Community Fund of Hong Kong, 2018). It shows that the importance of logistic requirement.
However, the knowledge and awareness of Halal supply chain are relatively lacking (Mohd Shariff, Yahya, Mohamad, 2016). Thus, the objectives of this research seeks to examine the relationship between of service importance and satisfaction of Halal restaurant in Hong Kong regarding to the Halal food transport logistics in Hong Kong, and its impact on the loyalty of the transport provider. The next section reviews previous research. The third section is present the methodology. The fourth present the discussion of result and the final section propose the recommendation and conclusion.
2. Literature Review
2.1 The Concept of Halal Logistics
Logistics is defined as all activities which facilitate movement and coordination of supply and demand in the creation of time and place utility (Haskett, 1973). Christopher (1988) described Logistics as “the process of strategically managing the procurement, movement and storage of materials, parts and finished inventory (and the related information flows) through the organization and its marketing channels in such a way that current and future profitability are maximized through the cost-effective fulfillment of orders.”
Tiemen (2013) stated that Halal logistics is the process of managing the purchase, transfer, storage, and control of material parts, livestock, partially finished or finished inventory of consumable and non-consumable products, and related data and certification flows through the business and the supply chain in accordance with the general doctrines of Shariah. Besides, the core fundamental of Halal supply chains is to avoid contact between Halal and Haram, the Muslim consumer requires a higher assurance of his Halal food, which is based on reducing the risk of contamination and the factor of perception of the Muslim consumer (Tiemen, 2011).
To secure a completeness of Halal food logistics. Lodhi (2009) believed that during the critical stage of logistics and supply chain activities, all Halal products must be protected from the final destination of non-halal production products or physical units. In order to maintain the integrity of Halal products, the capabilities and know-how of Halal Logistics are crucial. So Halal Logistics Company should establish a standard to protect Halal products from non-Halal production contaminations.
2.2 Service Quality Assessment
This section presents the important literature review indicating the measuring methods of service quality and criteria of courier quality assessment aiming to design the questionnaire. The study of Lai and Cheng investigated the supply chain performance (SCP) in transport logistics by service providers in the transport logistics industry in Hong Kong by Importance-performance Analysis. The questionnaire containing 26 items and divided into three aspects: Service effectiveness for shippers(SES); Operation efficiency for transport logistics service providers (OE) and service effectiveness for consignees (SEC). The research sample was 139 questionnaires, but 5 of them were not valid. The author specify the respondents were in what nature of business, number of employee and level of turnover. The results of the questionnaire is analyzed by Importance-Performance Matrix. The study results provide a benchmark for reference of firms in the industry and recommendation of improve SCP (Lai & Cheng, 2003).
Chou and Lu (2009) revealed that service quality, switching costs and consumer loyalty from home-delivery service’ customers’ perceptive in Taiwan. The paper included the survey and 372 out of 400 effective questionnaires were completed. The data was analyzed by several statistical techniques included t-test, reliability test, confirmatory factor analysis, one-way analysis of variance and structural equation modelling. The result of the paper is value to home-delivery service providers by gave them useful information on making their strategies and helped them to identify the strengths and weaknesses in order to improve their service (Chou & Lu, 2009).
The study of Lu (2003) concerned the perceptional differences between maritime firms and shippers with regard to the importance of and satisfaction with service attributes. The research focused on the relative importance of service attributes differed between shippers and maritime firms. In the survey, the respondent made the assessment of the importance and satisfaction of the criteria by five-point Likert scale where 1=Very unimportant/Very poor and 5=Very important/ Excellent. All the analysis were carried out by using SPSS. The research produced comparison of shippers’ and Maritimes firms’ importance and satisfaction levels by Quadrant scatter-plots, regression analysis and brought out a significant result (Lu, 2003).
2.3 Service Quality
Gronroos (1982) defined service quality as the outcome of an evaluation process that consumers make comparison of expectations between the service he perceived and received. Parasuraman et al. (1988) have defined service quality as the ability of the organization to meet or exceed customer expectations. Kim & Lee (2004) had similar claim, holding that service quality is the capability to meet customers’ requirement and needs. The service quality is based on the overall judgment of the customers’ expectation and perception. Service quality is the result by comparisons between customer expectations and perceptions of service delivered by the suppliers (Zeithaml et al., 1990).
Service quality is highly related to customers’ expectation and perception. Many journals have held that service quality is “the result of the comparison that customers make between their expectations about a service and their perception of the way the service has been performed” (Lewis & Booms, 1983;Lehtinen & Lehtinen, 1982; Parasuraman et al., 1985; 1988; Caruana, 2002).
Based on the above perspective, comparison between customers’ expectation and perceptions determines service quality. If perceptions exceed expectations, the service is good. If it only equals the expectations; it is good or adequate. If it does not meet them, the service is bad, poor or deficient (Keiningham, 2001). Oliver (1993) first suggests that service quality is antecedent to customer satisfaction. It is later supported by Anderson & Sullivan (1993); Fornell et al. (1996); Spreng & Macky (1996), stating that customer satisfaction is a product of service quality. Ekinci (2003) make it clear that service quality evaluation leads to customer satisfaction.
2.4 Satisfaction
Customer satisfaction is defined as a customer’s overall evaluation of the performance of a offer. (Johnson and Fornell, 1991) According to the study of Hansemark and Albinson (2004), “satisfaction is an overall customer attitude towards a service provider, or an emotional reaction to the difference between what customers anticipate and what they receive, regarding the fulfillment of some needs, goals or desire.”
Many researches have shown that service quality and customer satisfaction is related to customer loyalty through repurchase intentions (Levesque & Mc. Dougall, 1996; Newman, 2001; Caruana, 2002). According to Fornell, Claes (1992), the satisfaction has strong effect on customer loyalty intention. Success or failure of satisfaction is evaluated by change in customer retention. McAlexander et al. (1994) found that satisfaction has an important effect on future purchase intentions. Similarly, Oliver (1999) suggests that satisfaction is a significant affective element, which leads to repeated product or service usage. This is further supported by Ehigie (2006), who suggests that there is a significant positive relationship between customer loyalty and customer satisfaction.
2.5 Customer Loyalty
Customer loyalty is defined as a consumer’s intent to stay with an organization. Loyalty is a commitment shown by customers their determination to ultimately remain with or defect from a company (Zeithaml et al., 1996). Similarly, customer loyalty on the other hand refers to a commitment to rebuy a product or service despite situational influences for a long period of time (Oliver, 1997). It is a signal of retention or defection which should be predictable from individual-level behavioral intentions.
Loyalty is something long lasting. Gremler & Brown (1996) claims that loyalty is the degree to which a customer makes repeat purchasing behavior from a service supplier, acting positively toward the supplier, and only choose this supplier when a need arises. Further support is from Teich (1997), “Loyalty is developed over a period of time from a consistent record of meeting, and sometimes even exceeding customer expectations.” Palmatier et al. (2006) concluded by the claim that customer loyalty broadly refers to customer behaviors showing a want to a good relationship with a firm in long term.
It is believed that that service quality, satisfaction and loyalty are closely related. According to Bastos and Gallego (2008), customer service quality influences satisfaction and satisfaction directly affects personal behavioral intentions directly. Berezan et al. (2013) recognized the close relationship between loyalty and customer satisfaction while sees service quality is an important antecedent of customer retention (Prentice, 2013).
3. Methodology
3.1 Questionnaire Survey
A subjective approach was embraced and legitimized for this investigation keeping in mind the end goal to comprehend halal; and halal Logistics service in Hong Kong. Design that is qualitative was applicable as this was an exploratory and preparatory investigation that endeavors to investigate the individual experience of the witnesses being met, spoken to through account examination and understandings (Churchill, 1998). Qualitative methodology was proper on account of the idea of the exploration inquiries with what and how; moreover, to pick up a comprehension for this case halal transport logistics service in Hong Kong (Creswell, 1998). Information searched for was first shown and the going with were settled: sort of review and its method for association, substance of individual questions, kind of reaction to and wording of every request, course of action of request, and physical characteristics of the survey. The review was pre-attempted and changed where key. The survey’s substance authenticity was tried through a theoretical overview and pilot test, i.e., questions relied upon past examination, considers with different writing and discourses with industry related individuals and additionally project adviser.
The major input of the survey was developed with managers, owners, and front-line waiter or waitress. A preparatory draft of the questionnaire was then sent to a project advisor, who were requested to react to the inquiries and roll out proposals for conceivable improvements, augmentations, or erasures. The final questionnaire asked respondents about their importance level and satisfaction level with respect to nineteen service attributes based on their experiences and knowledge. The questionnaire measures included position of respondent, the established period of the restaurant, size, service attributes of Halal transport logistics services, and assessment of importance level and satisfaction level. We checked returned studies for missing data and reactions that would cause filtering mistakes. Subsequent to filtering, the reactions were foreign into IBM SPSS 25 and mistakes were checked against the individual structures. Information examination was finished utilizing Excel.
3.2 Measures
The measures of service importance and service satisfaction and customer loyalty have been adopted from previous studies (Lu, 2003; Chou & Lu, 2009). Measures of the respondents were requested to respond to each of quality measure twice. One is level of importance and the other one is level of satisfaction. Survey questionnaire were assessed on a five-point Likert scale, where “1” represented very unimportant and “5” represented very important for the level of importance part, “1” represented very poor and “5” represented Excellent for the level of satisfaction part. One-way analysis of variance, Importance-Satisfaction Matrix and correlation analysis were used to analyze data.
3.3 Data Collection and Sampling
As the first step in the study of this field, Halal restaurants were chosen as the research goal of this study because they are the key user of Halal food transport logistics service providers. Those restaurants with necessary knowledge and experience about the service of Halal food transport logistics service under the investigation. Moreover, those restaurants are important client of Halal logistics and their opinion are valuable. In this study, the questionnaire survey was carried out in February and March 2018, Restaurants in Hong Kong Island, Kowloon and New Territories recognized in the list of The Incorporated Trustees of the Islamic Community Fund of Hong Kong Halal Certified Food Premises are selected. Questionnaire are conducted on-person and on-site. After researchers arrived to the restaurant, respondents were informed the identity and the purpose of the study. Each respondent was understood the clause before they were willing to participant in the survey. In order to avoid disruption to the operation of Halal restaurants, survey conducted and completed during non-peak hour and after lunch hour.
Researchers was expected to obtain 54 completed questionnaires. However, some restaurants were rejected the questionnaire or employees were told not to receive any interview. Despite the drawbacks, researchers conducted questionnaire with 30 restaurants, consequently, total usable responses were 30 out of 54 of which 16 were Hong Kong Island restaurants, 8 were Kowloon restaurants, 5 were in New Territories, 1 was Theme Park Restaurant. The overall response rate for this study was eventually 55.56%.
3.4 Correlation Analysis
This study will test relationship between the two quantitative variables, the satisfaction level and the loyalty level by using the correlation analysis. As we hypothesized that there will be a positive correlation between variables, the resulting correlation coefficient ‘r’ should be closer to 1. In practical term, the closer the value of the correlation coefficient to 1, the higher positive impact on performance level on loyalty level. Generally, this study will be using the most popular correlation coefficient, the Pearson Correlation Coefficient. It is used to test for the linear relationships between our data.
3.5 Importance-performance Analysis
Importance-performance analysis (IPA) has been applied to assessing different aspects in the service industry (See Figure 1). This tool is used to identify the strengths and weaknesses on two dimensions: performance and importance (Martilla & James, 1977). These two dimensions are then integrated into a matrix that can guide researchers to identify the most appropriate strategic options for improving competitiveness (Lai & Hitchcoak, 2015). In this research, the two dimensional IPA model is divided into four quadrants with the level of importance on the x-axis and the level of performance on the y-axis.
Quadrant 1 (Low Importance/High Performance) Perceived as “Possible Overkill”. Attributes that fall into this quadrant are not important and not threatening to the organizations.
Quadrant 2 (High Importance/High Performance) Perceived as “Keep up the Good Work”. The industry achieved high levels performance and satisfaction here and measure are the strength.
Quadrant 3 (Low Importance/Low Performance) Perceived as “Low Priority”. Although the performance level of this unit may be low, managers should not be overly concerned because the attributes of this unit are not considered very important.
Quadrant 4 (High Importance/ Low Performance) Perceived as “Concentrate Here”. Industry should pay more attention to this area that need to be concentrated with top priority. This suggested should be concentrated.
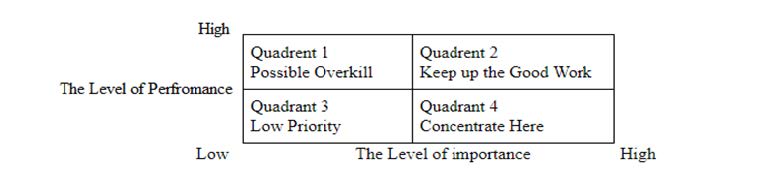
Figure 1 Importance-Performance Analysis
4.Results of Analyses
4.1 Respondents’ Characteristics
All analyses for this study were carried out using the SPSS 25.0 for Windows (2018) statistical package. Table 1 shows an overview and profile of respondents of our questionnaire survey, including their positions within the firm, the age and the scale of the firm which they worked. The position of manager was held most of the percentage of the respondents, which stands for 90 percent of the total respondents; 3.3 percent and 6.7 percent are the owner and the waiter/waitress respectively. Commonly, for the Halal restaurant in Hong Kong, are dominated by several large chain stores in Hong Kong, therefore, managers and waiter/waitress are the most commonly met respondent when we are conducting the questionnaire survey. Only a few chances that can directly contact with their owner, which is come from a small restaurant. Generally, for the situation in Hong Kong, almost all Halal restaurants, except some are owned and operated by the hotels, has no clear and exclusive division that are set up for the logistics operation, the missing organizational structure makes those responsibilities of overseeing and controlling the shipping or logistics are usually lied to the managers and front-line staffs. As we are looking for the data mostly regarding the logistics part of a firm, the knowledge and experiences of the managers and waiter/waitress would be useful enough because they are the front-line members that are handling those logistics day by day.
Besides, the distribution of the age of different restaurant are pretty even in general. 56.7 percent and 43.3 percent are the less than or equal to five-year-old firm and more than five-year-old respectively. Moreover, the majority of restaurants were scaled medium and large, which takes 53.3 percent and 36.7 percent total respectively. As mentioned before, there are only a little portion of restaurants is small scaled, which takes only 10 percent in total. The sample employed for this research project consists of different restaurant located in Kowloon, Hong Kong Island, New Territories and the Theme Park, while the hotel restaurant and airline kitchens cannot be covered. We employed as much usable responses as we can in order to make use of all possible responses because the population of halal restaurants is small relative to the overall catering industry. 54 questionnaires were distributed, but only 30 participants completed it. The location of the respondents shows a high variety, with the largest group coming from the Hong Kong Island (53.3 percent).
| Table 1. Profile of Respondents | ||
| Characteristics | Number | % |
| Position | ||
| Owner | 1 | 3.3 |
| Manager | 27 | 90.0 |
| Waiter/Waitress | 2 | 6.7 |
| Period of Establishment | ||
| 5 or below | 17 | 56.7 |
| More than 5 | 13 | 43.3 |
|
Number of Employees |
||
| 5 or Below | 3 | 10.0 |
| 6 – 10 | 16 | 53.3 |
| More than 10 | 11 | 36.7 |
| Total | 30 | 100.0 |
| Table 2. Response Rate for Question Survey | |||
| Respondents | Number Distributed
(A) |
Usable Responses
(D) |
Response Rate (%)
(D) / 30 |
| Hong Kong Island | 24 | 16 | 55.3 |
| Kowloon | 14 | 8 | 26.7 |
| New Territories | 6 | 5 | 16.7 |
| Hotel Restaurants | 6 | 0 | 0 |
| Theme Park Restaurants | 3 | 1 | 3.3 |
| Airline Kitchens | 1 | 0 | 0 |
| Total | 54 | 30 | 100 |
4.2 The Relative Importance and Satisfaction of Halal Food Transport Logistics
4.2.1 The relative importance of Halal food transport logistics services according to firm scale
Table 3 indicates that the relative importance of service attributes of Halal food transport logistics services differed among different scale of firms. Small scaled firms rated the accuracy of order and the on-time delivery are the most important areas; the medium scaled viewed accuracy of order, product returns and the document/ invoicing accuracy as the most important consideration; the large scaled firms reflected their most important concern are the on-time delivery.
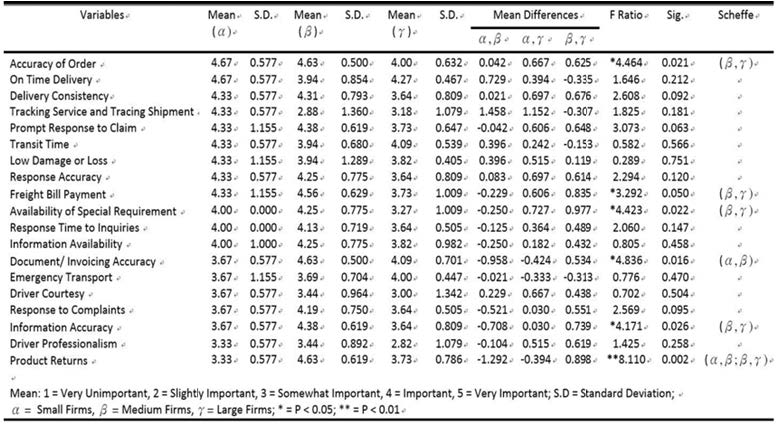
Table 3. The Relative Importance of Service Attributes in Halal Transport Logistics According to Firm Scale
In general, we can draw some results that: the level of importance service attributes by small firms are greater than medium firms as well as large firms. Five of the nineteen service attributes were significant at the 0.05 statistical level (accuracy or order, freight bill payment, availability of special requirement, document or invoicing accuracy and information accuracy) while one service attribute, product returns, was significant at the 0.01 statistical level for all scale of firms. The significant attributes are included: accuracy of order, freight bill payment, availability of special requirement, document/ invoicing accuracy, information accuracy and product returns. Findings therefore showed that service attributes’ importance differed significantly between different scales of firms.
Scheffe’s test is then conducted to find out the significantly contrasted mean within the three groups of data, the results are as follows: For the accuracy of order, freight bill payment, availability of special requirement, information accuracy, they differ significantly between medium and large firms; for the document and invoicing accuracy, it differs significantly between small and medium firms; for the mostly differed attribute, the product returns, it differs significantly between both small and medium scale, and medium and large scale.
4.2.2 The Relative Satisfaction of Service Attributes in Halal Logistics According to Firm Scale
The results regarding the satisfaction level with service attributes in different ages is shown Table 4. Generally, the satisfaction level pointed out by the small scaled firms is generally higher than expressed by medium firms which is followed by the large scaled firms except for prompt response to claim, transit time, response accuracy, freight bill payment, emergency transport, driver courtesy, response to complaints and product returns. Medium and large scaled firms indicated a higher satisfaction on those mentioned attributes.
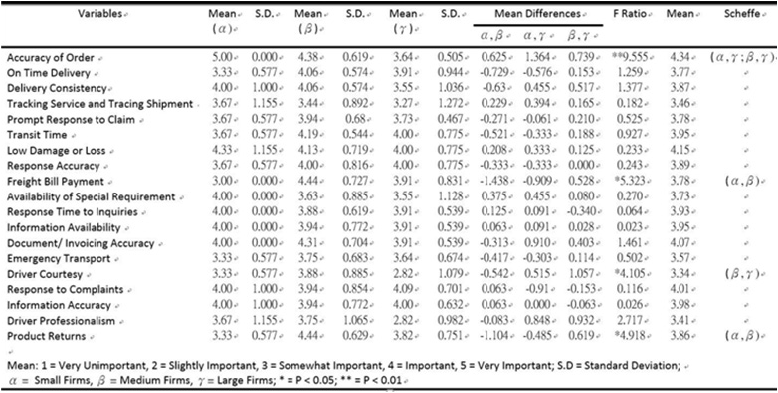
Table 4. The Relative Satisfaction of Service Attributes in Halal Transport Logistics According to Firm Scale
As shown in Table 4, accuracy of order, low damage or loss, document or invoicing accuracy and response to complaints were considered a relatively high satisfaction by firms with respect to all firm scale, which were scored over 4 on the 5-point scale. Conversely, the firms have shown dissatisfaction on tracking service and tracing shipment, emergency transport, driver courtesy and driver professionalism, the satisfaction level was rated below 3.57 on the 5-point scale, especially for the driver courtesy and driver professionalism, which scored only 2.82 by large firms. According to the One-Way ANOVA Test results, three service attributes were statistically significant at the 0.05 level for all firm scale: the freight bill payment, driver courtesy and product returns; one service attribute, accuracy of order has shown statistical significance with a 0.01 level. Additionally, the Scheffe’s Test has shown that the freight bill payment and the product returns were significantly different between the small firms and medium firms; the driver courtesy was significantly different between the medium firms and large firms; the accuracy of order was significantly different between the large firms and small/ medium firms.
4.3 Correlation Analysis Results Between Transport Logistics Services and Customer Loyalty
Table 5 shows the main constructs of Halal transport logistics services. According to the results from the correlation analysis (see Table 6), all variables are positively related among all pairs of correlations, the strongest correlation would be between accuracy and availability; accuracy and personnel; availability and personnel, as these three correlations are having a more than 0.75 Pearson’s coefficient, which is highly positively related between them, when one of them increases, the other increases together as well. In addition, the loyalty level is having positively correlations between all four elements, especially for the accuracy part. This result also implies that when the accuracy, time, availability and personnel performances have shown improvement, the loyalty level should be increased as well. Moreover, all of the resulting pair of correlations are having below 0.01 statistical significant level, which implies that the results show great statistical significances. Regarding the four elements, accuracy, time, availability and personnel, all the possible pairs of correlation included are showing a positive Pearson’s coefficient, i.e. they are positively related. As a result, the hypotheses H5, H6, H7, H8 are all strongly supported.
Table 5 Constructs of Halal Transport Logistics Services
| Accuracy | Time | Availability | Personnel |
| Accuracy of order | On time delivery | Emergency transport | Driver professionalism |
| Document/ invoicing Accuracy | Response time to inquires | Availability of special requirement | Driver courtesy |
| Delivery consistency | Prompt response to claim | Tracking service and tracing shipment | Response to complaints |
| Low damage or loss | Transit time | Information availability | |
| Response accuracy | Product returns | ||
| Information accuracy | Freight bill payments |
| Table 6. Correlation Analysis Results between Transport Logistics Services and Customer Loyalty | |||||||
| Descriptive | Correlations | ||||||
| Constructs | Mean | S.D. | Loyalty | Accuracy | Time | Availability | Personnel |
| Loyalty | 3.99 | .71 | |||||
| Accuracy | 4.03 | .46 | .648** | ||||
| Time | 3.93 | .41 | .477** | .577** | |||
| Availability | 3.81 | .53 | .607** | .772** | .522** | ||
| Personnel | 3.61 | .76 | .584** | .752** | .490** | .750** | |
| **. Correlation is significant at the 0.01 level (2-tailed). | |||||||
4.4 Importance-performance Analysis (IPA) Results
A quadrant scatter-plot was proposed to compare halal food logistics the importance and satisfaction of service attributes. Figure 2 shows a quadrant scatter plot based on the importance and satisfaction level of halal food logistics service attributes. Using IPA, each of the attributes was analysis in the order of relative importance and performance, move from the bottom of the IPM upwards and from left to right. One attributes (13) fall into the “Possible Overkill” quadrant, five attributes (1,2,12,18,19) belong to the “Keep up the Good Work” quadrant, seven attributes (3,6,7,8,9,10,14) are in “Low Priority” quadrant. Further, six attributes (4,5,11,15,16,17) are in “concentrate here” quadrant, which signifies they were perceived as relatively low in terms of performance and high in terms of importance (see Table 7).
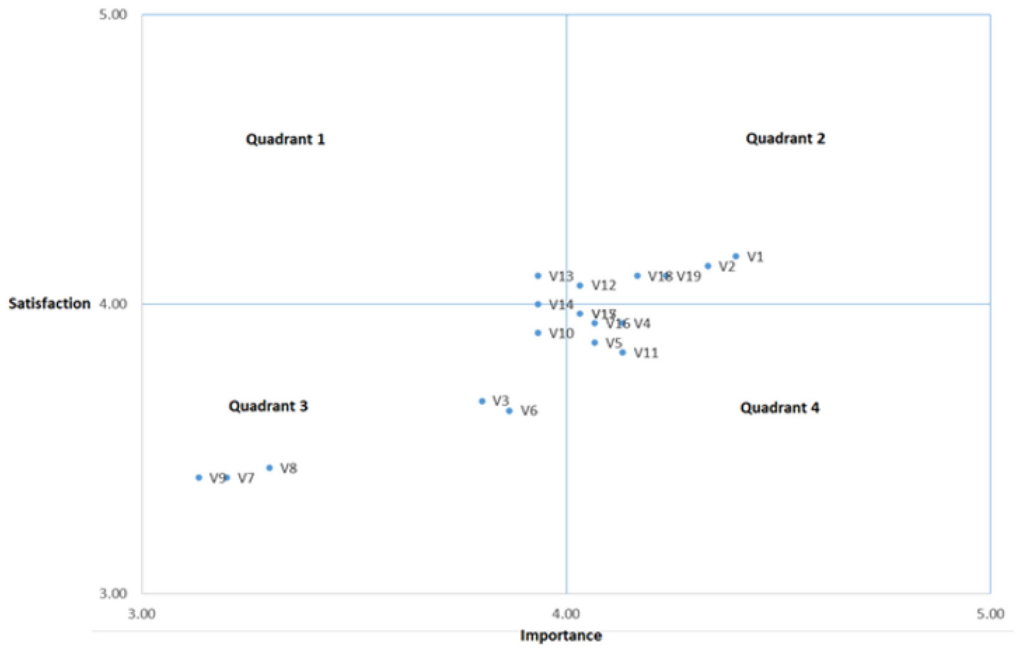
Figure 2 Importance-Performance Analysis Results
| Table 7: Results of Importance-Performance Analysis
|
||||||
| Importance Level | Satisfaction Level | |||||
| Quadrant | Item | Attribute | Mean | S.D. | Mean | S.D. |
| Possible Overkill
(Quadrant 1) |
13 | Low Damage or Loss | 3.93 | 1.015 | 4.10 | .759 |
| Keep Up the Good Work
(Quadrant 2) |
1 | Accuracy of Order | 4.40 | .621 | 4.17 | .699 |
| 2 | Document/ Invoicing Accuracy | 4.33 | .661 | 4.13 | .629 | |
| 12 | Transit Time | 4.03 | .615 | 4.07 | .640 | |
| 18 | Product Returns | 4.17 | .834 | 4.10 | .759 | |
| 19 | Freight Bill Payment | 4.23 | .898 | 4.10 | .845 | |
| Low Priority
(Quadrant 3) |
3 | Emergency Transport | 3.80 | .664 | 3.67 | .661 |
| 6 | Availability of Special requirement | 3.87 | .937 | 3.63 | .928 | |
| 7 | Driver Professionalism | 3.20 | .961 | 3.40 | 1.102 | |
| 8 | Driver Courtesy | 3.30 | 1.088 | 3.43 | 1.040 | |
| 9 | Tracking Service and Tracing Shipment | 3.13 | 1.252 | 3.40 | 1.037 | |
| 10 | Response Time to Inquiries | 3.93 | .640 | 3.90 | .548 | |
| 14 | Response to Complaints | 3.93 | .691 | 4.00 | .788 | |
| Concentrate Here
(Quadrant 4) |
4 | On Time Delivery | 4.13 | .730 | 3.93 | .740 |
| 5 | Delivery Consistency | 4.07 | .828 | 3.87 | .819 | |
| 11 | Prompt Response to Claim | 4.13 | .730 | 3.83 | .592 | |
| 15 | Response Accuracy | 4.03 | .809 | 3.97 | .765 | |
| 16 | Information Availability | 4.07 | .868 | 3.93 | .640 | |
| 17 | Information Accuracy | 4.03 | .765 | 3.97 | .718 | |
Using IPA, the attributes that attract great attention or under-perform can be recognized. Generally, firms in Halal food logistics have some room to improve themselves as 6 out of 19 attributes falls into quadrant 4. One possible explanation is that food logistics is a “time essential” service business, the ability to deliver food to restaurant on time right on time will be considered as “highly important” by restaurant for planning ingredient plan and they tolerate any delay (Attribute 4, 5). Meanwhile, as there are not many Halal food logistics providers in Hong Kong, restaurant do not have much choices, restaurant usually cannot get good answer from them (Attributes 11, 15). One the other hand, there are not much channel to reach information about Halal food logistic provider, if restaurant want to get comment and find logistics provider, they only rely on “word-of-mouth” from other restaurant (Attribute 16, 17).
Furthermore, the Halal food logistics “overkills” some performance areas. One reason is that industry companies think these performance attributes are too important for them. They are often reluctant to reduce these factors for reinforcement “Concentrate Here” attributes. One possible explanation is that Halal food have high standard and handling requirement, all provider must follow the rules regulated by The Incorporated Trustees of the Islamic Community Fund of Hong Kong, they invest a lot on it in order to make sure the food without any damaged (Attribute 13).
Moreover, the results indicate that the industry tends to put less into “low priority” since those attributes were perceived as relatively low in terms of both satisfaction and importance. One possible explanation is when restaurant have not enough some kind of ingredient, they used to borrow from other friendly Halal restaurant immediately. The help each other (Attribute 3). Meanwhile, driver is not skilled enough and not required appropriate knowledge (Attribute 7, 8).
Some attributes are considered as “Keep Up the Good Work” were perceived as high in terms of both importance and performance. Those are the strength and well-developed aspect of Halal food logistics in Hong Kong. As Halal concern about the accuracy and precision of the quality of the food and ingredient, the Board of trustee have a high standard to regulate those aspects on the Halal certification and inspector would check those firm weather fulfills the requirement. So the order, invoice must not involve any mistake. Otherwise Halal certificate might be deprived. (Attribute 1, 2). If restaurant discover the food or ingredient were contaminated or damaged, those set of ingredient cannot be used, it also affects Halal regulation, so product return is quite emphasized. (Attribute 18). Most of the fright bill payment are finished by cash and that is a most common way in this industry to finish the transaction (Attribute 19).
5.Conclusions
For the firms with different firm scale, opinion different in the importance level of accuracy of order can be interpreted as the large firms do not think this is less important comparing with that of smaller firms because their large restaurant network and storage, therefore, they can deal with the inaccuracy of order, or in other words, they have a supply margin or safety stock.
Additionally, this study provided the basis of the correlation between the factors and the loyalty level. According to our results, the measures categorized by factors are positively correlated to the loyalty level no matter what firm age and firm scale they are. The four factors are positively correlated to the loyalty level by having a positive coefficient ranging from 0.477 to 0.648. The most correlated factor is the accuracy while the least correlated factor is time. The accuracy factor affects the loyalty level the most, which implies that the firms are mostly putting the focus on how the logistics service order are done accurately. It might be a result of the ‘Halal’ concept focuses on the food and ingredient condition, instead of what time it will arrive or what kind of people are handling the order. The definite ‘Halal’ concept makes the logistics service provider to put more focus on the accuracy of order. The least correlated factor, time, might be explained by the interdependence of the halal restaurants. With reference to the interview to the restaurant manager we have done, he indicated that the situation of helping each other when ingredient supply is uncertain, is very common among the halal restaurant industry, large firm like Ebeneezer’s Kebab & Pizzeria would have its own large branch network while the small firms would form a intangible alliance to help each other when one of them needs any kind of resources.
This study has provided an assessment of Halal food logistics regarding to the level of performance and level of importance. The research results provide some perceptions for the reference of logistics providers in this Halal industry as their attempts to enhance their service. It is also important that the Halal logistics provider assess the strengths and weakness for improvement actions. Among the different attributes of services, six of them seems should receive greater attention as have largest space for improvement.
To improve on time delivery, set up on time delivery as target and promote the goal throughout the organization. Logistics provider should identify and recognize the reason why are the shipment arriving late. There are many factors that affecting the delivery such as weather, traffic jam, product availability etc. Logistics provider need to redesign the delivery plan like the organization schedules and communicates under different situation in order to eliminate the bottleneck. As for the delivery consistency, guidelines and rules should be clear stated. Logistics provider should consider that guidance could be demonstrated, and standard control should be set up in order to make the logistics process more stable and ensure the ingredient supply. To enhance prompt response to claim and response accuracy. It is important that for set up more communication channel such as online platform and establish the claim procedure for restaurant. Logistics provider also disclose more information and make restaurant easy to access especially to those new entrants of Halal restaurant.
The study findings, however, suffer from several limitations. Population size is too small. Our research is based on Halal logistics, which is a concept relatively new. The available research materials and data has been already limited. In addition, people in Hong Kong are not familiar with Halal concept. For collecting first hand research materials, we have to conduct interview with Halal business operators, such as restaurants in Hong Kong. However, the number of Halal restaurants in Hong Kong is not too much, with around 50 in total only. We visited nearly all of the Halal restaurants, doing interviews as many as we can. However, some of the restaurant owner and manager rejected our interview invitation. This make the situation even worse. We only got around 30 interview samples, which is not really desirable for research.
5.1 Limitations
Some interview questions we designed were too sensitive for interviewees. For the purpose of finding a comprehensive assessment in Halal food supply chain situation in Hong Kong, we try to make questions relates every possible aspect. Some of the interview questions are thus related to financial performance. The Questions “How much was your revenue per month?” and “What was the growth rate of revenue in your restaurant last year (2017)?” are included in our interview. We know that these questions may be sensitive. So, we set it in a range only for different choice. However, these questions are still too sensitive to most of the interviewees. They are unwilling to answer them. So, part of questions is incomplete at the beginning. After consideration, the two questions are cancelled but it did not affect the result of the survey.
5.2 Future Research
The future research could assess similar issues and related conditions inside the extended structure of a multinational correlation. Case studies of the Halal Logistics performance in other countries such as Malaysia and Singapore could be assessed to make relevant comparison between cases. Moreover, although the response rate in this study (55.56%) is fair enough, the sample size is quite enough to provide more significant results. The major reason for the small sample size is that the market of halal logistics and the market of its users, the halal restaurants, are not large enough, the development is still fresh. The future and further studies can put more concentration to the adjustments in market and it would be gainful for the future research to recreate this investigation with various information gathering techniques and tests to triangulate the discovery. Last but not least, regression analysis could be done in future researches on the same case because it is useful to see the detailed implication between different factors. More samples should be assessed. Also, Halal transport logistics transport providers might also be considered in the future researches to make a more comprehensive results.
References
- Ahmad, N. & Mohd Shariff, S. (2016). “Supply Chain Management: Sertu Cleansing for Halal Logistics Integrity.” Procedia Economics and Finance, 37, 418-425.
- Anderson, E.W., Fornell, C., & Lehmann, D.R. (1994). “Customer satisfaction, market share and profitability: findings from Sweden.” Journal of Marketing, 58(3), 53-66.
- Bastos, J. A.R., and Gallego, P.M. (2008). “Pharmacies Customer Satisfaction and Loyalty: A Framework Analysis.” Journal of Marketing, Universidad de Salamanca
- Berezan, O., Raab, C., Yoo, M., & Love, C. (2013). “Sustainable Hotel Prac-tices and Nationality: The Impact on Guest Satisfaction and GuestIntention to Return.” International Journal of Hospitality Management, 34, 227–233.
- Caruana, A. (2002). “Service loyalty. The effects of service quality and the mediating role of customer satisfaction.” European Journal of Marketing, 36(7/8), 811-828.
- Chou, P. F, Lu, C. S. & Chang, Y. H. (2014). ”Effects of service quality and customer satisfaction on customer loyalty in high-speed rail services in Taiwan.” Transportmetrica A: Transport Science, 10:10, 917-945.
- Chou, P. F. & Lu, C. S. (2009). “Assessing Service Quality, Switching Costs and Customer Loyalty in Home‐Delivery Services in Taiwan.” Transport Reviews, 29:6, 741-758.
- Christopher, M. (1998). Logistics and Supply Chain Management: Strategies for Reducing Cost and Improving Service, (2nd Ed.), Prentice Hall, New York, USA.
- Ehigie, B. O. (2006). “Correlates of customer loyalty to their bank: a case study in Nigeria.” International Journal of Bank Marketing, 24(7), 494-508.
- Ekinci, Y. (2003). “An investigation of the determinants of customer satisfaction.” Tourism Analysis, 8(2), 193-196.
- Fornell, C. (1992). “A National Customer Satisfaction Barometer: The Swedish Experience.” Journal of Marketing, 56 (January), 6–21.
- Fornell, C., Johnson, M.D., Anderson, E.W., Cha, J. & Bryant, B.E. (1996). “The American customer satisfaction index: nature, purpose and findings.” Journal of Business Research, 60(4), 7-18.
- Gremler, D. D. & Brown, S. W. (1996). “Service loyalty: its nature, importance and implications.” Proceedings American Marketing Association, 171-180.
- Grönroos, C. (1982). “A service quality model and its marketing implications.” European Journal of Marketing, Vol. 18 No. 4, pp. 35‐42.
- Hansemark, O. C. & Albinson, M. (2004), “Customer Satisfaction and Retention: The Experiences of Individual Employees.” Managing Service Quality, 14 (1), 40-57.
- Heskett, J. L., Glaskowsky, Jr, N. A. & Ivie, R. M. (1973). Business logistics; physical distribution and materials management, Ronald Press Co, New York, USA.
- Johnson, M. D. & Fornell, C. (1991), “A Framework for Comparing Customer Satisfaction Across Individuals and Product Categories.” Journal of Economic Psychology, 12 (2), 267–86.
- Keiningham, T. L. & Vavra, T. G. (2001). The customer delight principle: Exceeding customers’ expectations for bottom-line success. McGraw-Hill, Chicago, USA.
- Kim, W. G., & Lee, H.Y. (2004). “Comparison of web service quality between online travel agencies and online travel suppliers.” Journal of Travel & Tourism Marketing, 17(2/3), 105–116.
- Lai, I. K. W. & Hitchcock, M. (2015). “Importance–performance analysis in tourism: A framework for researchers.” Tourism Management, June 2015, 48, 242-267.
- Lai, K. H. & Cheng, T. C. E. (2003). “Supply chain performance in transport logistics: An assessment by service providers.” International Journal of Logistics Research and Application, Vol.6 (3), p.151-164.
- Legislative Council Secretariat (2017). “Religious facilities in Hong Kong.” Fact Sheet, FS01/17-18.
- Lehtinen, U., & Lehtinen, J.R. (1982). “Service quality- a study of dimensions.” Unpublished working paper, Service Management Institute, Helsinki, 439-460.
- Levesque, T.J. & McDougall, G.H.G. (1996). “Determinants of customer satisfaction in retail banking.” International Journal of Bank Marketing, 14(7), 12-20.
- Lewis, R. C., & Booms, B. H. (1983). “The marketing aspects of service quality. Emerging Perspectives in Service Marketing.” In Berry, L. L., Shostack, G. and Upah, G. (Eds) American Marketing Association, Chicago,IL 99-107.
- Lodhi, A. U. (2009). Understanding Halal Food Supply Chain, HFPC UK Limited, Cheshem, UK.
- Lu, C. S. (2003). “An Evaluation of Service Attributes in a Partnering Relationship between Maritime Firms and Shippers in Taiwan.” Transportation Journal, Vol. 42, Iss.5, 5-16.
- Martilla, J. A. & James, J. C. (1977). “Importance – performance analysis.” Journal of Marketing, 41(1), 77-79.
- McAlexander, J.H., Kaldenberg, D.O., & Koenig, H.F. (1994). “Service quality measurement.” Journal of Health care Marketing, 14(3), 34-40.
- Mohd Shariff, S., Yahya, S. & Mohamad, S. (2016). “Halal Supply Chain Awareness: Initial Case Study in Hong Kong.” J. Appl. Environ. Biol. Sci., 6(11S) 64-71, 2016.
- Mohd Shariff, S., Yahya, S. & Yeung, M. C. (2016). “Initial Exploratory Qualitative Study on Halal Supply Chain Awareness in Hong Kong.” Qualitative Research Conference 2016, 140-149.
- Newman, K. (2001). “Interrogating SERVQUAL: a critical assessment of service quality measurement in a high street retail bank.” international Journal of Bank Marketing, 19(3), 126-139.
- Oliver, R. L. (1997). Satisfaction: A Behavioral Perspective on the Consumer, Irwin/McGraw‐Hill, New York, NY.
- Oliver, R. L. (1999), “Whence Consumer Loyalty?.” Journal of Marketing, 63 (Special Issue), 33–44.
- Oliver, R.L. (1993). “A conceptual model of service quality and service satisfaction: compatible goals, different concepts.” Advances in Service Marketing and Management 2: 65-85.
- Palmatier, R. W., Dant, R. P., Grewal, D., & Evans, K. (2006). “Factors influencing the effectiveness of relationship marketing: A Meta- Analysis.” Journal of Marketing, 70, 136-53.
- Panda, T. K. (2003). “Creating customer lifetime value through effective CRM in financial services industry.” Journal of Services Research, 2(2), 157-171.
- Parasuraman, A., Zeithaml, V. A. & Berry, L. L. (1988). “SERVQUAL: a multiple-item scale for measuring consumer perceptions of service quality.” Journal of Retailing, 64(1), 12-40.
- Parasuraman, A., Zeithaml, V.A., & Berry, L.L. (1985). “A conceptual model of service quality and its implications for future research.” Journal of Marketing, 49, fall.
- Prentice, C. (2013). “Service Quality Perceptions and Customer Loyalty inCasinos.” International Journal of Contemporary Hospitality Management,25(1), 49–64.
- Spreng, R.A., Mackenzie, S.B. & Olshavsky, R.W. (1996). “A re-examination of the determinant of customer satisfaction.” journal of Marketing, 60(3), 15-32.
- Teich, I. (1997). “Holding on to customers: the bottom-line benefits of relationship building. Bank Marketing.” 29(2), 12-13.
- The Incorporated Trustees of the Islamic Community Fund of Hong Kong (2018). “The Incorporated Trustees of the Islamic Community Fund of Hong Kong Halal Certified Food Premises.”
- The Incorporated Trustees of the Islamic Community Fund of Hong Kong (2018). “Halal Certification Process Guidelines Form (HC-3).” http://www.islamictrusthk.org/introduction/
- Tieman, M. (2011). “The application of Halal in supply chain management: in-depth interviews.” Journal of Islamic Marketing, 2(2), 186-195.
- Tieman, M. (2013). “Establishing the principles in halal logistics.” Journal of Emerging Economies and Islamic Research, 1(1), 1-13.
- Zeithaml, V. A., Berry, L. L. & Parasuraman, A. (1996). “The behavioural consequences of service quality. Journal of Marketing Management.” 60(No. April), 31-46.
- Zeithaml, V. A., Parasuraman, A. & Berry, L. L. (1990). Delivering Quality Service, The Free Press, New York, N.Y.














 RSS訂閱
RSS訂閱